VISUALIZE INFECTION PORTLET
About
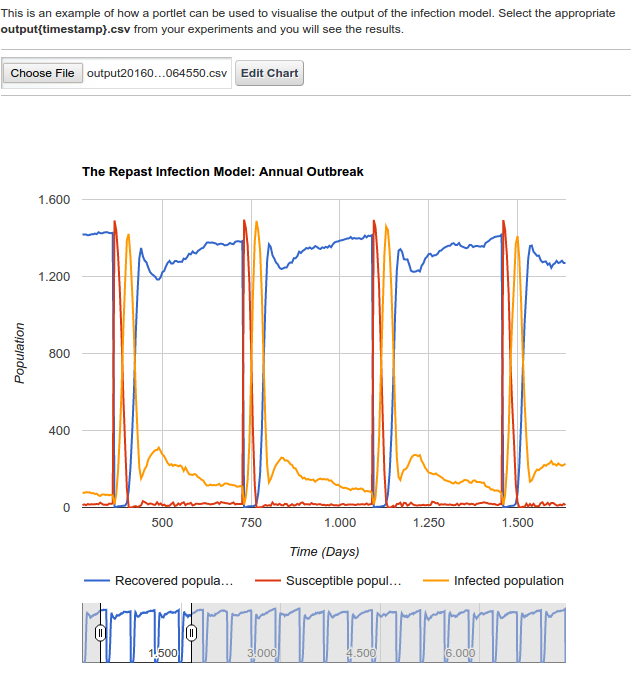
The visualize portlet is just a simple demonstration graph tool that allows users to see the graphical visualisation of the results output file, which has been generated using the infection model-portlet. This helps users to understand the significance of their results, by placing it in a visual context. Patterns, trends and correlations that might go undetected in text-based data can be exposed and recognized easier by making use of this tool. Consequently, when a job is ready and the output is collected, a user can upload the output file, using this portlet (infection model visualisation tool) on the science gateway and a graphical view of their jobs would be generated. The visualize tool graph has two major axis, namely the population and the time (in days). It also has a view to represent the different types of population. i.e the recovered, susceptible and the infected population.
Installation
This section explains how to deploy and configure the visualize-infection-model-portlet into a Science gateway to submit some preconfigures experitments towards Distributed Computing infrastructures.
1. Move into your Liferay plugin SDK portlets folder and clone the infectionModel-portlet source through the following git command:
git clone https://github.com/csgf/visualize-infection-model-portlet.git
2. Now, move into the just created infectionModel-portlet directory and execute the deploy command:
ant deploy
When the previous command has completed, verify that the portlet is “Successfully autodeployed”, look for a string like this in the Liferay log file under $LIFERAY_HOME/glassfish-3.1.2/domains/domain1/logs/server.log.
3. Then, open your browser and point at your Science Gateway instance and from there, click Add > More in the Brunel University category, click on Add button to add this new portlet. The Following picture shows the correct view:
Usage
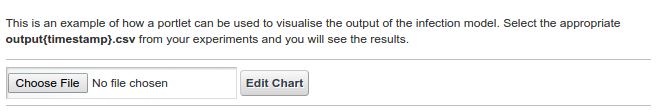
The following figure show the view of the visualize-infection-model-portlet and how it can be used to visualize output file results on a cloud based system.
The visualize portlet can simply be used by uploading the output file, which was generated from the infection model portlets. This is done by simply clicking on the choose file icon, on the visualzse portlet page as shown above, and users can select the appropriate output.csv file from among their experiments. This will automatically generate a graphical view of their jobs.
Contributor(s)
If you have any questions or comments, please feel free to contact us using the Sci-GaIA project dicussion forum (discourse.sci-gaia.eu)
| Authors: | Roberto BARBERA - University of Catania (DFA), Adedeji FABIYI - Brunel University London (BRUNEL), Simon TAYLOR - Brunel University London (BRUNEL), Mario TORRISI - University of Catania (DFA) |
|---|